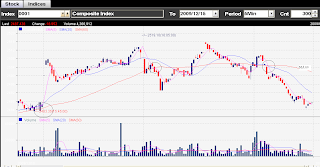
This is one way to find out the movement of stock indices in the BEI (Bursa Efek Indonesia)
From the picture above, so MA60 very influential and can be used as an indicator to see the movement of stock index BEI/IDX.
Value Index fell showed that part of the stock price falls, and if the index value rose so much of the stock price rises.
This is very good indicators in use by, daily trader, where the timeframe that the use is 5 minutes.
Buy a position, if the line had been hit by MA60 upwards by candelstick that goes upward and the position is valid if candelstick maintain its position above the 60 MA lines.
selling position, if candelstik passed down the line toward the MA60.
So essentially, if the line above candelstick position MA60 buy, and if done under the MA60 line sales position.
Sunday, December 13, 2009
Subscribe to:
Post Comments (Atom)


0 comments:
Post a Comment